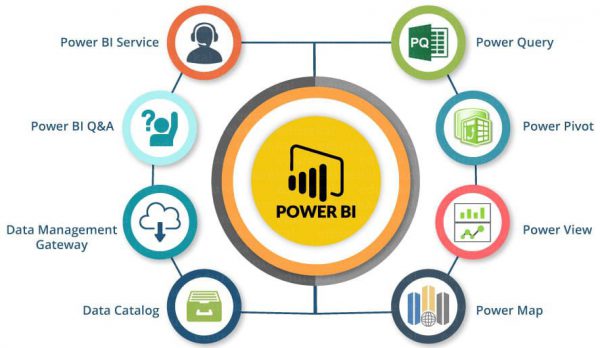
Power Query: It can be used to search, access, and transform public and/ or internal data sources.
Power Pivot: It is used in data modelling for in-memory analytics.
Power View: You can analyze, visualize, and display data as an interactive data visualization using Power View.
Power Map: It brings data to life with interactive geographical visualization.
Power BI Service: You can share data views and workbooks which are refresh-able from on-premises and cloud-based data sources.
Power BI Q&A: Ask questions and get immediate answers with natural language queries.
Data Management Gateway: By using this component you get periodic data refreshers, expose tables, and view data feeds.
Data Catalog: Users can easily discover and reuse queries using the Data Catalog. Metadata can be facilitated for search functionality.
Power BI’s architecture has three phases. The first two phases partially use ETL (Extract, Transform and Load) to handle the data. Let us take a look at these phases one by one:
- Data Integration
An organization can be required to deal with data that comes from different sources. The data from data sources can be in different file formats. The data is first extracted from different sources which can be your different servers or databases etc. This data is then integrated into a standard format and then stored at a common area called a staging area.
- Data Processing
The integrated data is still not ready for visualization because the data needs processing before it can be presented. This data is pre-processed or cleaned. For example, missing values or redundant values are removed from the data set. After the data is cleaned, business rules are applied to the data and it is transformed into presentable data. This data is then loaded into the Data Warehouse.
- Data Presentation
So once the data is loaded and processed it can be visualized using a variety of top customizable visualizations that Power BI has to offer. Use of reports and dashboards can help one represent what was once raw and disparate data, more intuitively. These visual reports help business leaders make calculated and strategic business decisions based on the insights that are available at a “switch of a button”.


